TabPy is a tool that lets you run Python code from Tableau. It can be a very useful tool if you need to manipulate or analyze data in a way that is not easy to accomplish with Tableau alone. I’m going to focus on using TabPy with Tableau Prep in this discussion. There will also be a little bit of machine learning, but that is not the primary subject. The sample project that will be built for this discussion is a simplistic logistic regression model that takes various health factors polled from Americans, found in the Diabetes Health Indicators Dataset, and tries to determine whether or not they are likely to have pre-diabetes or diabetes.
If you would like to check out the code it can be found here https://github.com/xylotope/TableauPrepTabPy.
Setup TabPy
In order to get started using TabPy with Tableau Prep, you need to have an instance of the TabPy server configured and running.
If you don’t already have this you can check out https://github.com/tableau/TabPy for a download and installation instructions.
If you already have a TabPy server running somewhere then great! You can just continue on to setting up the connection in Tableau Prep.
Build the Model
If you are not interested in the machine learning part, you can skip this section and move onto the setup of Tableau Prep.
The dataset that I chose to work with is titled diabetes_012_health_indicators_BRFSS2015.csv and can be found in the Diabetes Health Indicators Set. I used the Diabetes_012 field as the target variable and all the remaining columns I used as features. I capped the Diabetes_012 field so that it was a 0, no diabetes, or 1, pre-diabetes or diabetes. It was originally setup as 0, no diabetes, 1, pre-diabetes, or 2, diabetes. I used sci-kit learn to train a logistic regression model of the data. That model is then saved to a file using joblib so that it can later be imported into the script that Tableau Prep uses.
Setup Tableau Prep
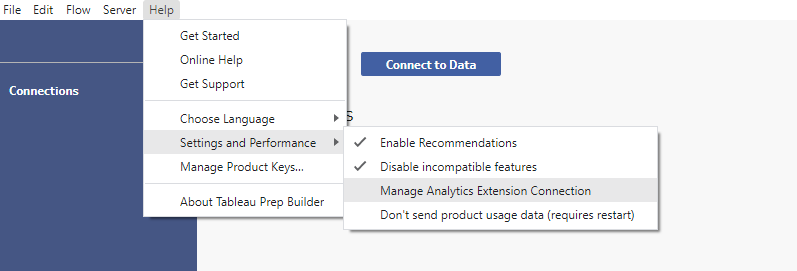
You will need to enter some information into Tableau Prep so it knows where and how to connect to the server. As of the time of this is written, you can do that by opening Tableau Prep, going to Help at the top right, Settings and Performance, and then clicking Manage Analytics Extension Connection.
After you select this option, a popup will appear that asks for information about the server you are trying to connect. Make sure that TabPy is selected then fill in the rest of the information. If you are running the TabPy server locally, you can enter 127.0.0.1 for the Server. The default port is 9004, although this can be changed in the TabPy configuration file. Then you will need to enter your username and password if you have setup a password file, which is highly recommended.
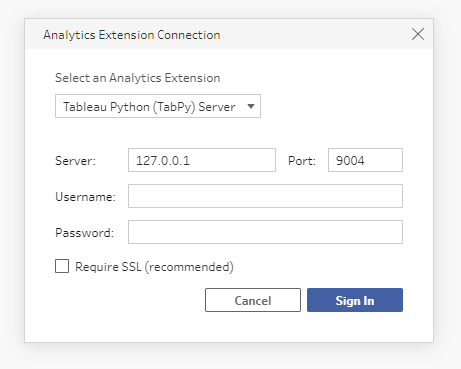
Once you enter all the appropriate information you should be able to Sign In and move on to actually using Tabpy with your data.
Connect to Data
Now that Tableau Prep is configured to use TabPy, you’ll need to connect it to a data source.
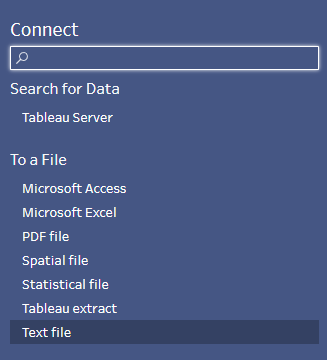
For this example, I’ll be using the Diabetes Health Indicators Dataset from Kaggle to build the regression model. I’ll also be using a test data file that I generated our_members.csv. If you would like to follow along, you can download the data, select Connect to Data in Tableau Prep, and then choose Text file to open the data. Specifically, I will be using the our_members.csv file in Tableau Prep.
Creating a Script
Working with TabPy is a little different in Prep than in Tableau Desktop. In Tableau Desktop, you can create calculated fields that make calls to Python. In Prep, however, you create a pretty normal script. The script can include imports just like the ones below.
import pandas as pd
from sklearn import preprocessing
from joblib import load
from sklearn.preprocessing import StandardScaler
Where it starts to get a little weird is how Prep interacts with your script. It doesn’t just run the whole thing from top to bottom. You select specific functions that you want to call from Prep. These functions take a Pandas DataFrame as input and return a Pandas DataFrame as output. It would look something like the following for our current example.
def predict(input: pd.DataFrame) -> pd.DataFrame:
    regr = load('regr.joblib')
    X = input.iloc[:, :].values
    sc = StandardScaler()
    X_scaled = sc.fit_transform(X)
    y_pred = regr.predict(X_scaled)
    return pd.DataFrame({
        'Prediction' : y_pred,
        'HighBP' : input['HighBP'],
        'HighChol' : input['HighChol'],
        'CholCheck' : input['CholCheck'],
        'BMI' : input['BMI'],
        'Smoker' : input['Smoker'],
        'Stroke' : input['Stroke'],
        'HeartDiseaseorAttack' : input['HeartDiseaseorAttack'],
        'PhysActivity' : input['PhysActivity'],
        'Fruits' : input['Fruits'],
        'Veggies' : input['Veggies'],
        'HvyAlcoholConsump' : input['HvyAlcoholConsump'],
        'AnyHealthcare' : input['AnyHealthcare'],
        'NoDocbcCost' : input['NoDocbcCost'],
        'GenHlth' : input['GenHlth'],
        'MentHlth' : input['MentHlth'],
        'PhysHlth' : input['PhysHlth'],
        'DiffWalk' : input['DiffWalk'],
        'Sex' : input['Sex'],
        'Age' : input['Age'],
        'Education' : input['Education'],
        'Income' : input['Income'],
})
The function above takes a DataFrame as input, loads in a regression model, creates a prediction based on the values passed in from Tableau Prep, and returns a DataFrame that matches the data coming from Prep, except for one additional field that has been created called Prediction that contains the results of the function.
An interesting point to note is that you must either pass back the same fields structure that was passed to your function or declare your own by defining the function get_output_schema in your script.
def get_output_schema() -> pd.DataFrame:
    return pd.DataFrame({
        'Prediction' : prep_int(),
        'HighBP' : prep_int(),
        'HighChol' : prep_int(),
        'CholCheck' : prep_int(),
        'BMI' : prep_int(),
        'Smoker' : prep_int(),
        'Stroke' : prep_int(),
        'HeartDiseaseorAttack' : prep_int(),
        'PhysActivity' : prep_int(),
        'Fruits' : prep_int(),
        'Veggies' : prep_int(),
        'HvyAlcoholConsump' : prep_int(),
        'AnyHealthcare' : prep_int(),
        'NoDocbcCost' : prep_int(),
        'GenHlth' : prep_int(),
        'MentHlth' : prep_int(),
        'PhysHlth' : prep_int(),
        'DiffWalk' : prep_int(),
        'Sex' : prep_int(),
        'Age' : prep_int(),
        'Education' : prep_int(),
        'Income' : prep_int(),
})
The above code demonstrates how the get_output_schema function was designed for my script. The available datatype functions that Prep currently accepts are prep_string(), prep_decimal(), prep_int(), prep_bool(), prep_date(), and prep_datetime().
I chose to declare the whole new output structure with my one additional field, but there are other options you could use to get your data out. One would be to create the field in a Clean step before creating the Script step. Then, you wouldn’t have to define the get_output_schema function. In other cases you might not need all the fields. Maybe you only want the single result or the result paired up with an index. The index could later be matched back up to other data.
Adding a Script
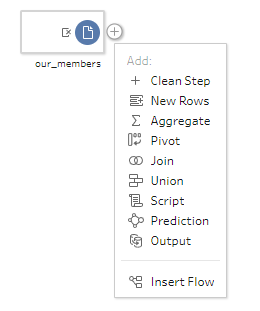
Once you have Tableau Prep connected to your data, you can start using TabPy by adding a Script to your flow.
Click the + icon next to your data and select Script.
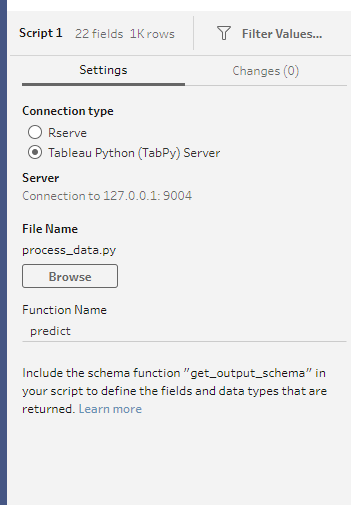
In the Script pane, select Tableau Python in the Connection Type, browse to the location of your Python script using the Browse button, and type the name of the function you want to execute on the Function Name line. After you hit enter or press the Refresh data button at the top of the screen, your calculation should populate.
Keep in mind that your TabPy server may have a timeout period, depending on how it was setup, so if your calculation takes too long, TabPy might cut you off.
Now that your flow is up and running and processing data using Python you can create an output step and export your data to be used in a Tableau workbook.
Leave a Reply